Function...ing well
Functions! A huge part of Mathematics, which is used in various other fields, like Physics, Chemistry, Biology etc. I am going to show you a way to have some fun with the graphic representations of some FUNctions and mostly the parabola. I know that there are some people who may not know what functions are or may have forgotten everything that has to do with them. If you are one of those people, you can see below some basic information about them. It will be almost impossible to enjoy the most part of this website without that knowledge. If you are 100% sure that you remember the basic characteristics of the functions, feel free to skip this intro and start reading the text bellow the blue button (bellow the title " FUNctions: parabola construction"). Side note: throughout the website, there are some proofs that require some basic math knowledge to understand. Apart from them (which exist to satisfy math lovers) the content can be easily understood without any deep knowledge of Mathematics.
Imagine you have two groups containing some elements. Today we are only going to talk about groups of numbers. The first one is independent, meaning any number could belong there, unless you set a restriction that excludes some numbers. Its official name is "domain". A function is a rule that connects those groups. For example, it may square the numbers in the first group and put the results in the second one. The second one contains only the results, and that's why not any number can be there. It depends on what numbers the independent one contains. That's why it is dependent. Its name is "codomain".
Functions have a basic rule: under no circumstances is an element from the first group allowed to match more than one element of the second one. Attention: this doesn’t mean that an element in the second group can't be matched with multiple elements of the first one. This will be clearer with a picture.

There are various ways to represent a function, apart from the one you just saw on the image. We are not going to go through them, because they have nothing to do with the content of this website. We are only going to talk about one of them: graphic representation.
Basically, when you write a function, you usually symbolize it with f(x), even though sometimes other letters are used instead of f. It is called "f of x" and x refers to the element of the domain and f(x) to the element of the codomain. For example, f(x)=2x+8 is a function where you take every element of the domain, multiply it by 2, then add 8 and then you put the result in the codomain group. Now, if you want a graphic representation, instead of f(x) you write y. For example, y=2x+8. Each point in a graph is described with (x,y), with the first one showing how right/left is and the second how up/down is. Since we have the ratio of x and y, we could draw a line uniting all these points. This is the graphic representation.
Now, someone may think that it is impossible to draw an infinite number of points. Yes, it is true. However, that line is either going to be a straight line or a curve. 2 points are required of a straight line and 3 for a curve (in specific positions), so no worries about it. In order to know how many you need to draw, there is a trick: the equation of a straight line is y=ax+b or more formally ax+by+c=0 (a,b,c literally any number-however, if b=0 in the second equation, we no longer have a function, you will see why in a little bit). A parabola (type of curve) has the equation of y=ax^2+bx+c (with a being different with zero, because if it was zero, it would be a straight line). There are even functions with higher powers on the x, but we aren't going to go into them. They are all some kind of curves that require 3 points in specific positions, but these are rare and we aren't going to talk about them.
Something I have said before is "under no circumstances is an element from the first group allowed to match more than one element of the second one". In a graph, it means that no point is allowed to have the same "x", or abscissa (to say the name correctly) with another one. That's the reason that an equation without a y-term can never be a function. A vertical line is never a function. However, a horizontal one, when all points have the same "y" or ordinate (that's its actual name) as its formal name is, is a function.
There is that one type of curve called "parabola". It is a very interesting function and it is the one we will talk about for the most part of the website. Its domain and codomain are always all real numbers, symbolized with ℝ. You can of course define the domain to be smaller, for example all real numbers from 3 to 7 (with those two included) and it is symbolized with [3,7]. However, this is not called parabola, it's just a function. It is symmetrical, but it doesn't continue to infinity, like the parabola.
Last but not least: why do we even need to know about functions? It's because they are used in countless other fields. One of the most common uses is to see how something changes over time. It could be for example how polluted the air is over time or showing the position of a snail in function with time. In those cases, the y axis is always the axis of time. You may ask why. The answer is hidden in the definition of functions. Haven't we said that it is impossible for two points to be on the same vertical line, but completely fine if they are in the same horizontal line? Just like that, it is impossible for the snail for example to be at two places at the same time, the nature is not FUNCTIONing like this. Yet, it is perfectly normal to be at the same place for some time (it means it has stopped).
Well, I think now you know enough to be able to read the website. Enjoy! 🙂
FUNctions: parabola construction
A parabola is basically a curve. So, how will we draw one on a piece of paper? Some of you may say that we could create our own mathematical equation, then add the points on the diagram and lastly draw a line passing through those points. Well, yes, this is one way to do it, but it takes a lot of time and effort. Another way is using a compass or a round object, like a bottle, but this is boring. We are here to do something fun and a little bit surprising, aren't we?
So, what are we going to do? How will we draw a curve without a curvy instrument? There is a guaranteed way to make a good one and the only instrument you need is... a ruler! Not only is this possible, but also very easy and extremely fun!
The process:
Firstly, take a sheet of paper. Ideally, it is separated into little squares. The second best is a notebook sheet with lines. If you have neither, just take an empty one. Use a pencil for the drawings, so that it will be easier to erase some lines if you make a mistake. To start, draw two lines crossing at 90 degrees, which have little arrows at the end. One of them will be parallel to the bottom of the page. This is axis x. The other one, which is parallel to the side of the page, is axis y. Use a pencil for the drawings, because a lot could go wrong and you might need to erase some lines.


I guess you have completed the first step to read this. After the axes are ready, you need to mark some points on them. The more you mark, the better. The points should be equally distant from one another and the distances between two random neighboring points need to be the same on the two axes. If you use a blank sheet of paper, use the ruler so the distance is for example 1cm. If you use a notebook, use its lines for measurement (count the space between 2 continuing lanes to put the points correctly on axis x; in my notebook it was 0.8 cm) and if your paper has squares on it, use them. Important note: the number of points for each axis should be equal. See the pictures to make sure that you have followed the instructions correctly.


Okay, now we are going to the second-last step. You need to put some numbers on the points, for convenience’s sake. The top point in axis y is 1, the point below it is 2 etc. (note: this is not the proper way to name points on axis y, but it is temporal; after we finish you can fix it). On axis x, the further left point is number 1, then the point at the right side of it is 2 etc. You need to check the pictures and then your own shape carefully to make sure that you have done it correctly, because even a single mistake in the numbers can ruin the fun.


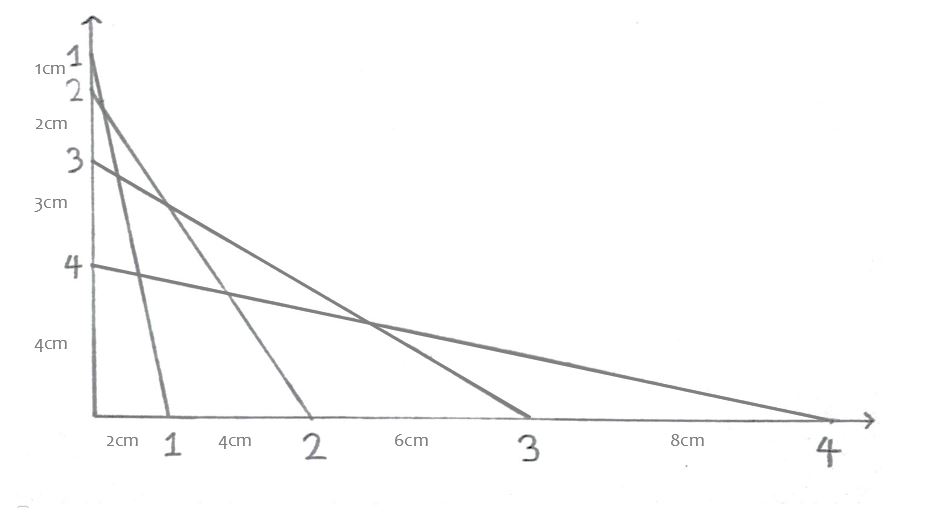
Now, the cool part begins. You need to perform a simple task: draw a straight line with the ruler between numbers that are equal. Point 1 of axis y will be connected to point 1 of axis x, point 2 of axis y with point 2 of axis x etc. Please finish this small task and then seek the answer, because magic exists only when you do it yourself. Cheating ruins fun.


Wait, what? Do you see what I see? Does this look like a parabola? Well, you are not completely done, because there is a last step "hidden" in the explanation of this method, in order to make your shape even better. Let's find out!
How does this method work?
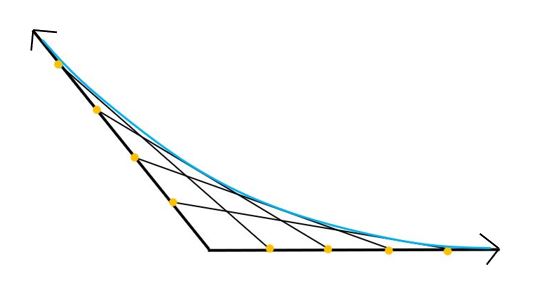
To understand the method behind this madness, we need to go to a completely shaped parabola, like this.


There is a theorem in Mathematics which states that "the slope of a straight line is equal with the trigonometrical tangent of the angle which the line makes with the positive direction of the axis x (basically it is the left of the two angles which are formed above the axis x)". Now, to take it a little bit further, you may have a curve and want to find its slope at one point (read here why you could want that). It is obvious that all points that belong in a parabola have different slopes, otherwise it wouldn’t be a parabola. To do that, you draw a tangent to the parabola, which touches it at the point where you are trying to find the slope. You need to do the trick with the trigonometrical tangent (or use any other way) to find the slope of the line. Since the point belongs to the line, the slope of the line will be equal with the slope at this point.
I know, that was a big introduction, but I had to write it. But really, what does it even have to do with whatever I want to prove? It turns out, it plays an important role. See, those lines are the tangents. The ones which touch a point of the parabola to help us determine the slope at that point. So, there is exactly one point of each line that belongs to the parabola.
If you have read carefully what I said earlier, you may realize that I said look like a parabola and there is a good reason for that. All those lines come really close to the actual parabola, but they will never form an actual one. So, if you feel like scammed, there is still a way to create the actual parabola. Yet, you need to understand a bit more, so that you will be able to draw it more easily.
Why do those lines look like a curve in the first place? If you have used a well-sharpened pencil, you may realize that there are some angles at the points were 2 lines meet on the "parabola". Those angles are a little smaller than 180˚. The more lines you draw, the bigger the angles will be, but they will never be 180˚ or more. Take a closer look.
Can you spot the angles in the first one? What makes the two pictures different? The second picture shows basically the same, just with a green line, doesn't it? No. The green "line" is in fact not even a line. It is the area that is missing from the shape, for it to become a parabola. If you look closely, you may realize that it is thicker in some places that some others. Confusing, isn't it? We will take a better look now.

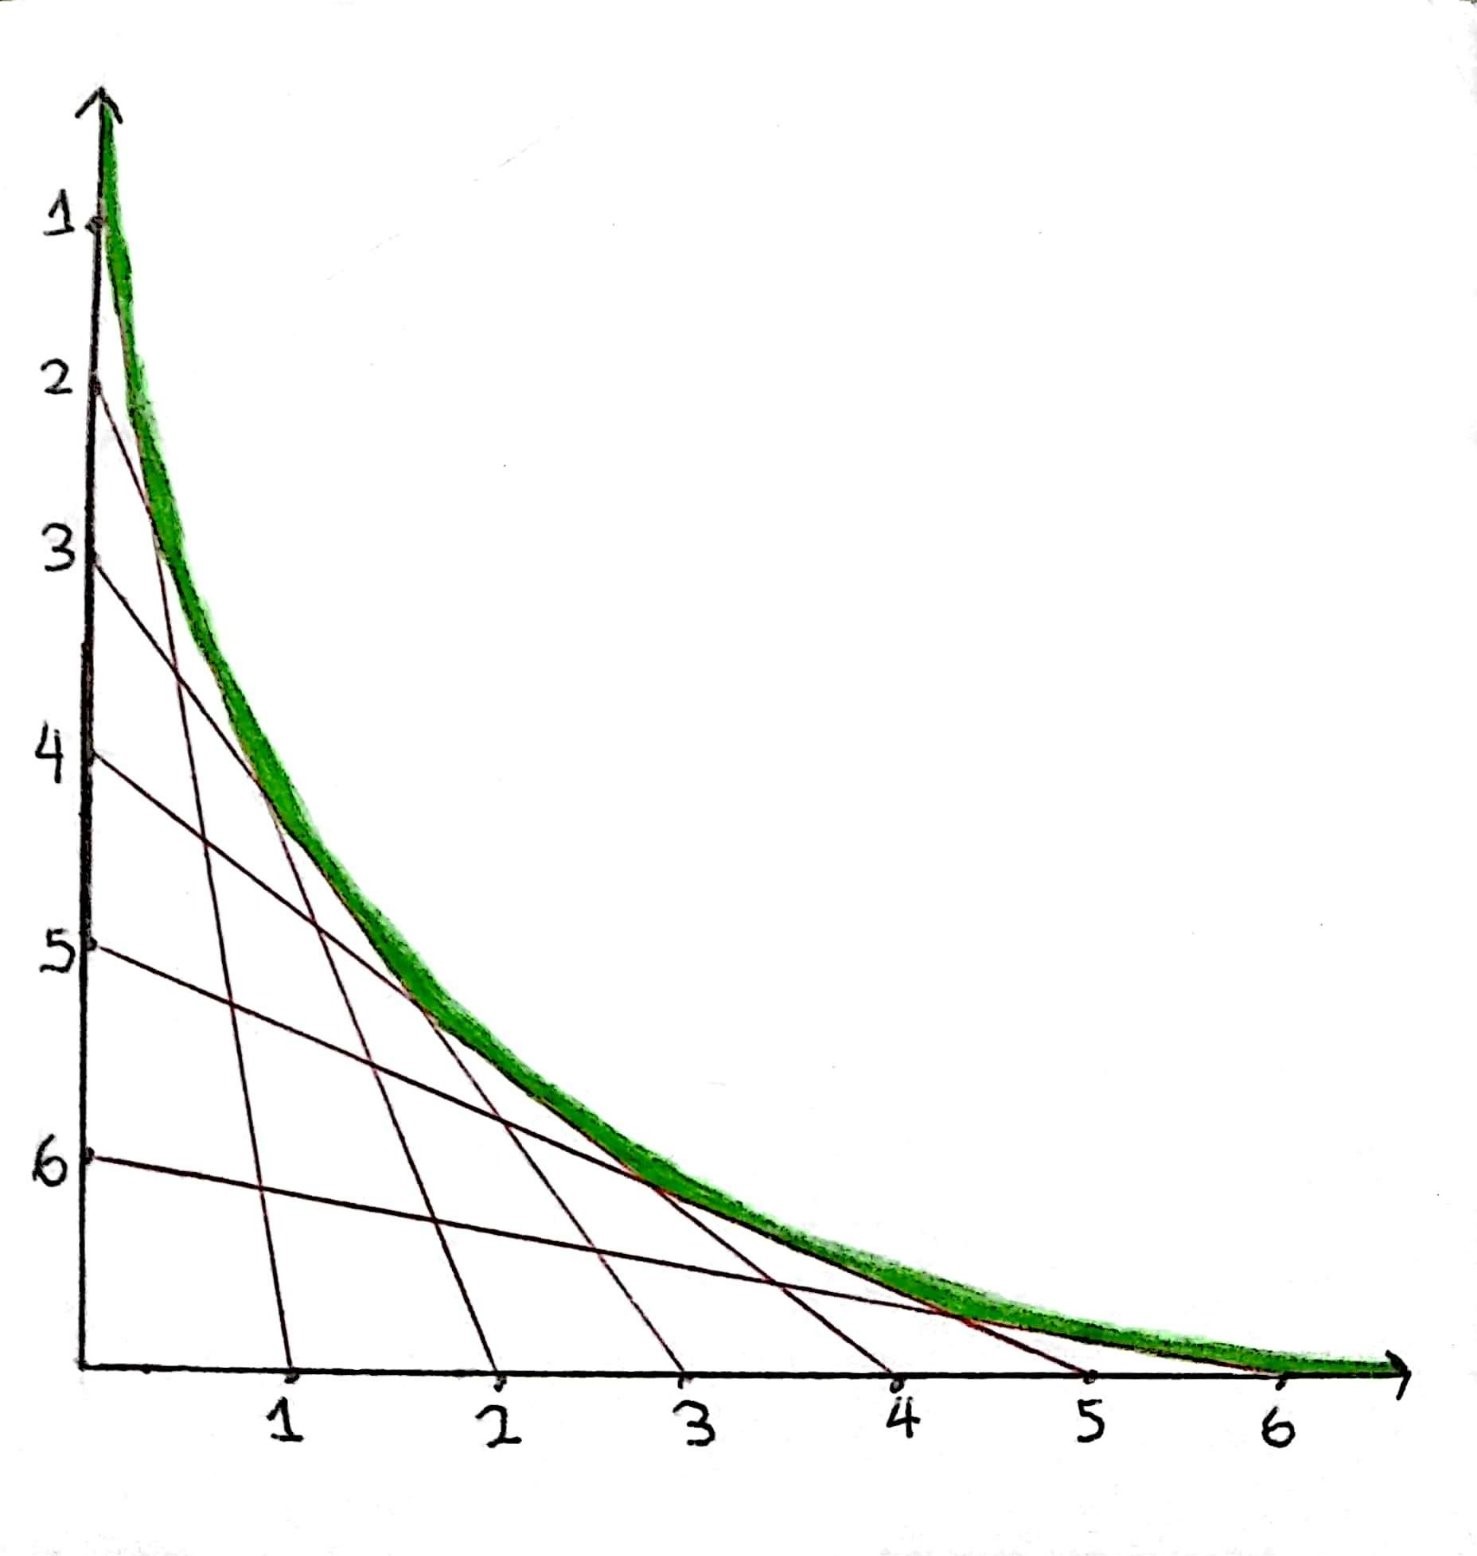
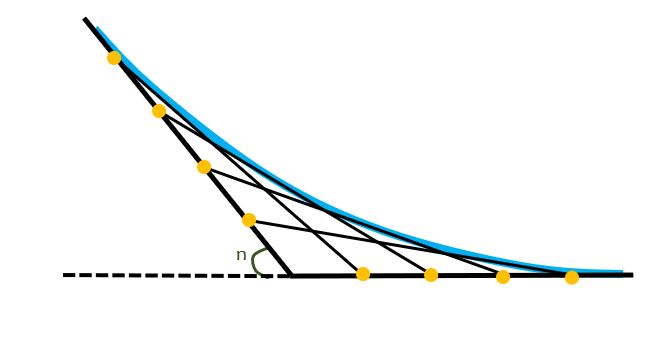
To understand the situation with the lines better, we should draw one more line: the axis of symmetry of this parabola. This is the line that splits it in half. The reason we need this line is to help us understand that whatever happens on its one side, needs to happen on the other as well.
- If the parabola you drew has an even number of points (so an odd number of edge-lines), then the axis is the line that passes through the point where the x&y axes meet and the middle of the centrical edge-line. For example, if the parabola has 5 edge-lines, it will pass from the middle of the 3rd one.
- If the parabola has an odd number of points (so an even number of edge-lines), then the axis is the line that passes through the point where the x&y axes meet and the point where the 2 centrical edge-lines meet. For example, if the parabola has 4 edge-lines, it will pass from the point that the 2nd and the 3rd edge-lines meet.

As we saw earlier, those lines approximate a parabola, but we are here to draw a real one. To be correct, our parabola needs to be completely symmetrical according to the axis of symmetry in the places where it touches the tangent lines. Each tangent line needs to be touched only once by the parabola (by definition). Important note: the parabola needs to pass through the point which the axis of symmetry meets the centrical edge-line, if we have an odd number of edge-lines. There are two ways of making the parabola symmetrical. Well, one of those is a special category of the other, but is so common, that deserves a separate description. Anyway, here they are:
- This is the most common one, because it is the easiest. It is the one mostly used by physicists or other scientists when they want to get as close as possible to the real parabola. They mark the center of each edge-line and make a line that passes through those dots and doesn't touch any other part any tangent line. The touching points with the axes are half the distance between two neighboring points. This line is the parabola.
- As we have said, we only need to have a symmetrical parabola, so it is not a necessity that it touches the center of the tangent lines. If you want to have some fun, try this: mark the points that the parabola is going to pass through, randomly on the edge-lines. Then, use the axis of symmetry to help you draw the rest points on the other half. Remember: this line is just like a mirror. If you have a small mirror, you may use it to help you. To draw the line that passes through all points (your parabola!), make sure that it touches the edge-lines and the axes only once.


So, why have I been saying all those tiring math properties about those lines? Because they will help you improve your shape and make it look closer to an actual parabola. You may have realized that there are infinite parabolas being tangents to the lines, but if you have followed the instructions, you may have drawn one of those. Congratulations! 🙂
Where is this method even used?
Now, you may say: what you showed is very interesting, but is there any field in which it is implemented in any way? Well, yes! Both directly and indirectly, from art to physics. Let's find out!
Art: Of course, this magical way is implemented in art. This is widely used in sewing. Is has a lot of advantages:
- It is very easy to do because it consists only of straight lines
- The results are always stunning
- It doesn't require any extra materials
- It is difficult to create a normal curve with a needle without looking messy
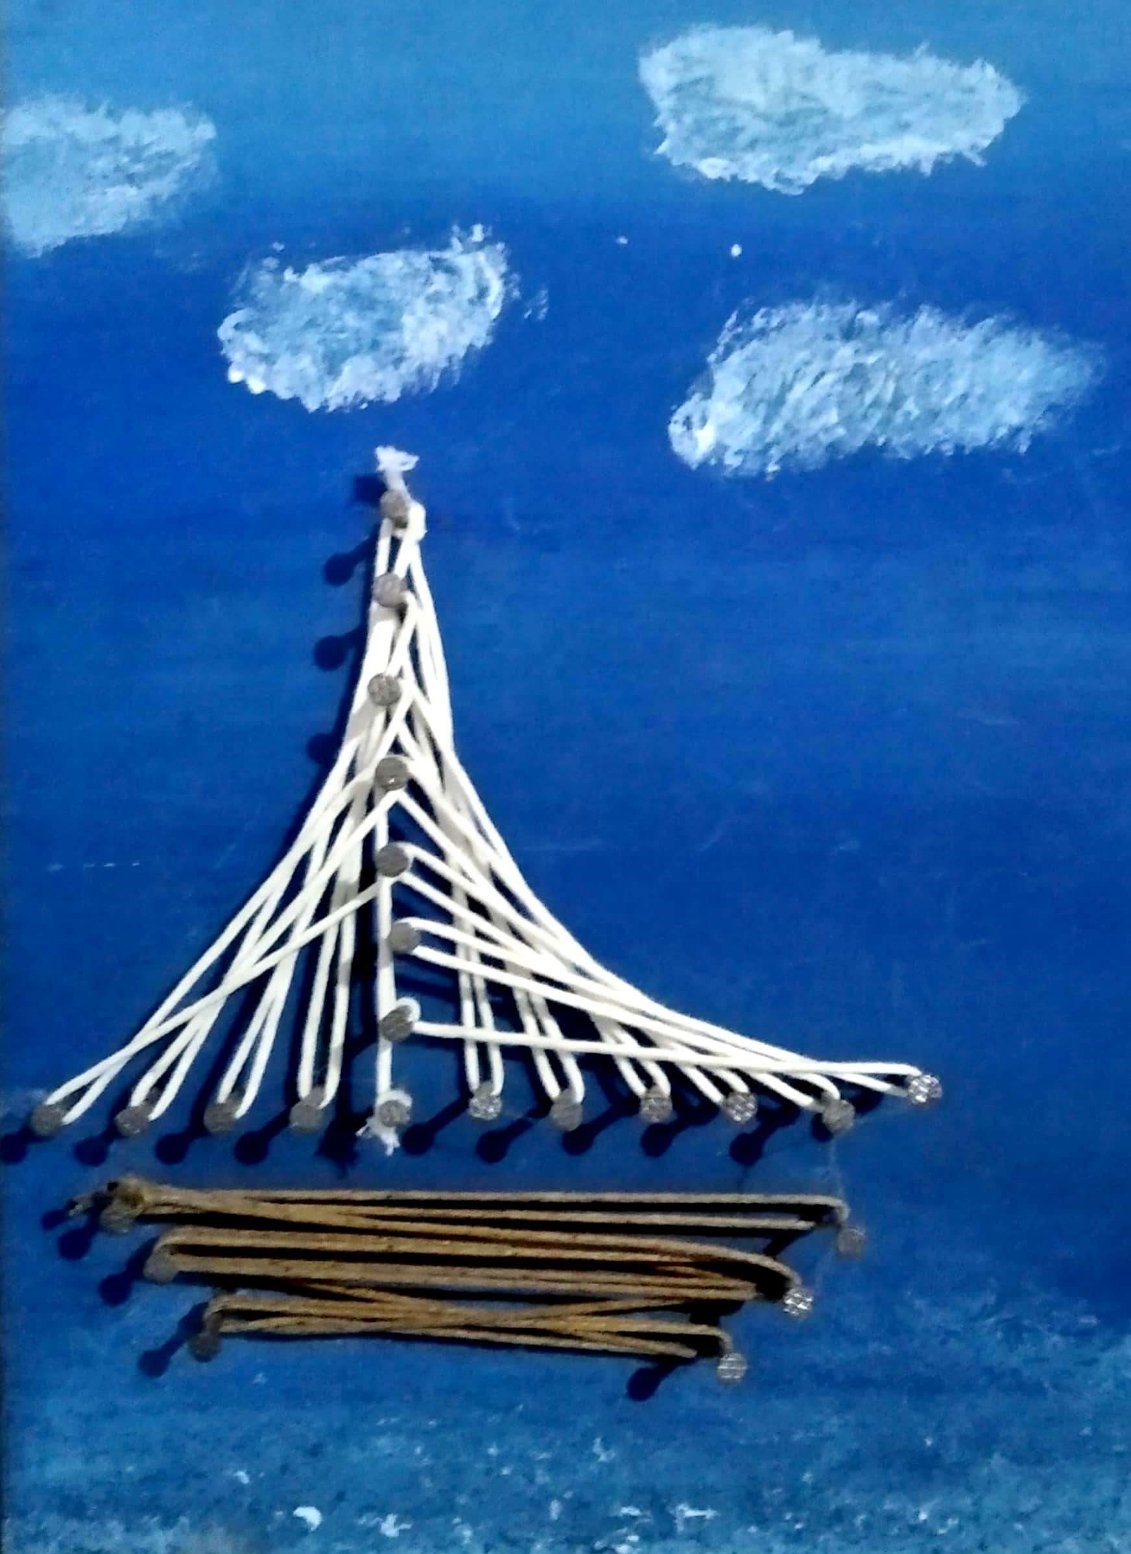


Well, the last one isn't exactly a parabola, it's just a lot of curves combined. The only material used is a piece of paper and two pens. Yet, it uses the curving technique so well, that I had to add it.
- To be honest, most people use their computers now if they want to draw a parabola, so most of them have never heard of that cool method. However, sometimes in physics, you can't help but use it. Here is an example:
Well, sometimes, this phenomenon pops us unexpectedly in daily life. If you pay close attention, you will spot it everywhere.
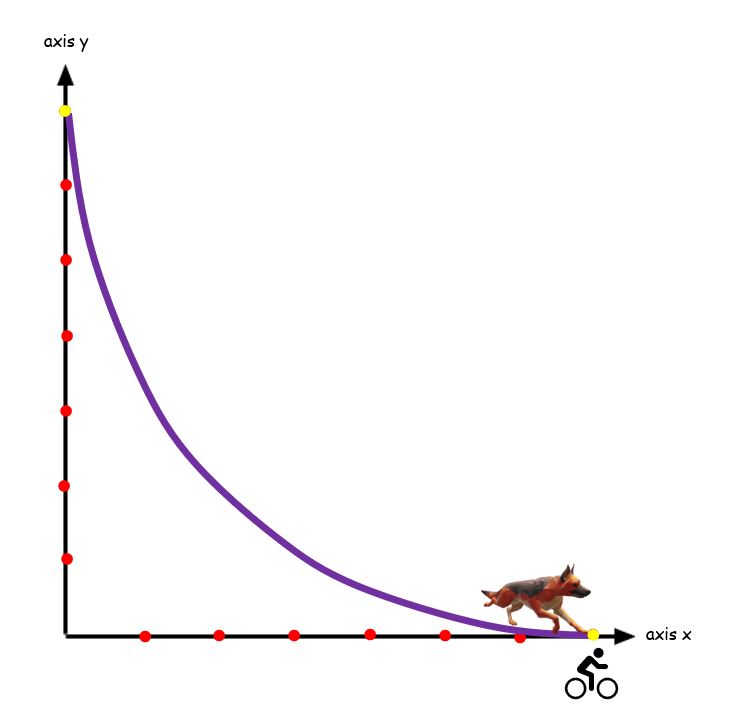
Imagine that you are riding your bicycle on the bike lane, when suddenly, your dog spots you and wants to join you. You continue going in a straight line, but the dog's path is very interesting. I know that the information is a lot and you need some pictures, so here they are. You are both going at a constant speed and you start (0.7), whereas the dog from (7.0).

The image below shows what the dog thinks the path will look like. However, a detail is ignored: you are moving.

What does the dog do, to keep in pace with you? It changes its path all the time! This is one of the times it changes its path.

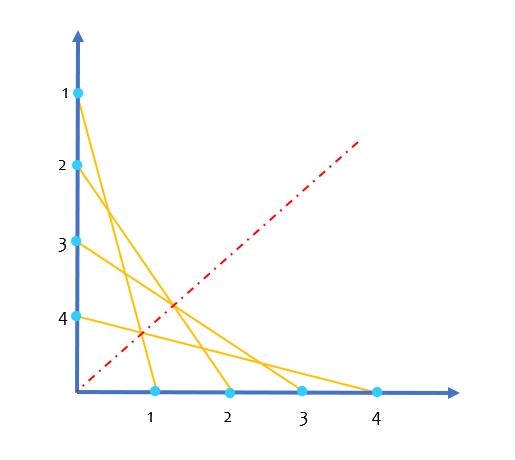
However, you are still moving. It will need to change its path all the time, until it finally reaches you. This approximates its final path.

Does this look familiar to you? That pattern with the straight lines? Maybe now?

Yes, that's the exact shape I have been talking about for the most part of the website! In this case, the path of the dog is a parabola and we are trying to get as close as possible to it, by drawing straight lines. If you remember from above, the more points, the closer it gets to a parabola. I have used only 7, so it is not very close, but it is a good approximation of the actual one.

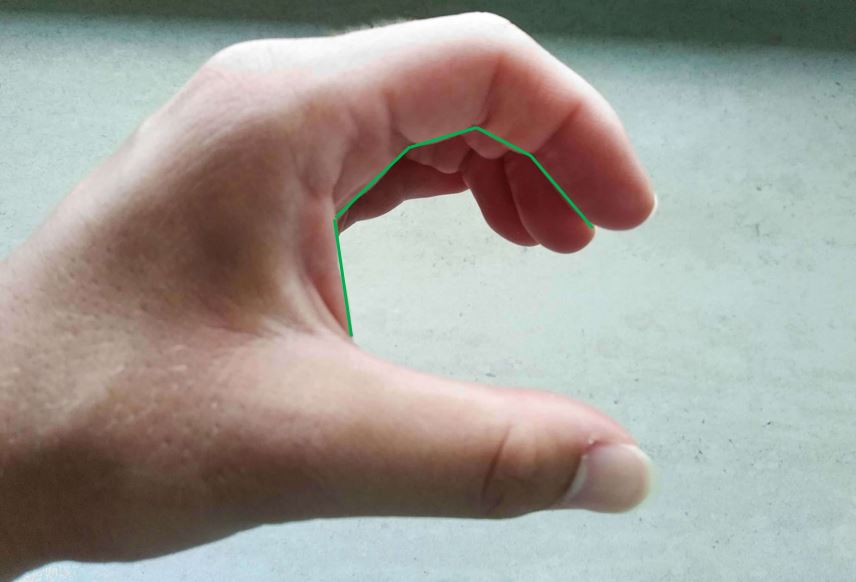
Do you see what I do? Look carefully at the green lines.
Extra details for extra curious people
If you are generally curious you may like to read that extra information about those lines that approximate the parabola.
- You may have drawn all those lines, made the parabola, but felt like there is two details missing: it is not properly placed in the orthonormal system of axes and it is not fully completed (only the first half is drawn). Both problems are solvable!
- For the first one, while guiding you to draw the parabola, I told you to name one line axis x and the other one axis y, but you may have realized that the numbering in axis y was not made properly. That was on purpose wrong and now it is time to fix it. However, you don't have to name that line axis y. You can do it with any other line parallel to it you like! (if the line isn't parallel, two points will have the same abscissae and when this happens, we will no longer have a function). The same happens with the axis x, any line parallel to it (since it must be vertical with axis y) is perfectly suitable!
- For the second one, if you want to get that cup shape which usually comes to mind when thinking about the parabola, look no further. You just need to draw a line parallel to the "axis y". Now, you need to use a ruler to make sure that the distance between the initial "axis y" and the vertex is equal to the distance between the line you drew and the vertex. Now, you repeat the same process with the creation of the parabola. It's that simple!

- Do you remember, when I told you at the beginning of the drawing part some rules to follow, for the parabola to be good? Well, to be honest, most of them were made for convenience’s sake, for you to learn the process more easily. Yet now you must be experts in that method, to read this. So, what if we spice up a little bit our creations?
One of the first steps was to name axes x and y, but now you know that you are the one who determines which the axes are if the lines you chose are parallel to the originals. What if I told you that the original lines (the ones only used for drawing the parabola) don't even need to be vertical? (Yet, the final axis x needs to be horizontal and the final axis y needs to be vertical to it) Yes, the exact same method is totally valid for angles that are from 90˚ to 180˚.

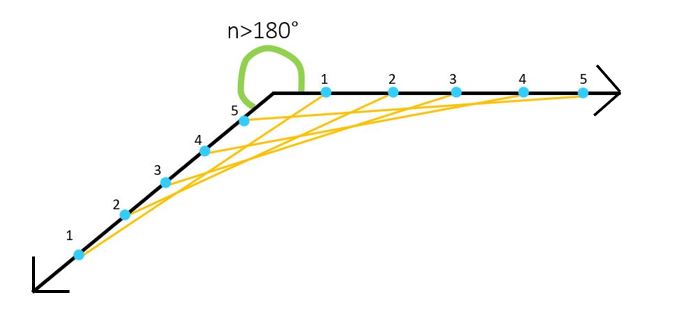
For angles more than 180˚, it is just like the angle being less than 180˚, but upside down (there is a picture bellow that explains it).
What about acute angles? Even though it is possible to draw a curve with an angle of less than 90˚, it is impossible for it to be simultaneously a function, because it is sure that two point will have the same abscissae and when this happens, you can't have a function.

What happens if the angle is exactly 180˚? Well, in this case, we will have a function, but not a curve, because it will be just a straight line. In the picture bellow you will be able to see why it is a straight line with the different colors I used for the "edge lines".

- I guess that most of you drew the parabola in the first quadrant (on the right of axis y and above axis x), because that's how the example was. You may have moved the axes, you may have drawn the other half, but all those parabolas have something in common: they have a lowest point, meaning that they look like a smile 🙂 (if the whole of it is drawn; otherwise it's just half a smile, like this one -but as if the smile was on the left side of its face-😏). Did you know that there is a way to make them look slightly different, without drawing anything? This is possible by turning them 180˚ (upside down). This way, they will resemble a sad face 🙁 and they will still be functions. Now, you can have even more fun if only half of the parabola is drawn. Why? Because there are even more ways to turn it and still be a function! You need to set some restrictions though: this function won't be a parabola, because we will have to define its domain. The domain of a parabola is always ℝ (all real numbers). So, this function will be just the curve that you see on your piece of paper and won't continue to infinity. Each function has its own "limit" for turning and still being a function, which is easy to calculate. To do this, we need to find the two angles that the two "axes" form. There is always an acute angle (marked with "n") and an obtuse angle (the lines are over it) or two right angles. Let's see each case independently. The starting point of turning the function is going to have "axis y" in horizontal position, while being above it.
- An acute and an obtuse angle: We need to use a protractor to find how big the acute angle (the one marked with "n") between the "axes" is. This is essential for calculating the "limit" of the non-valid turning. We need to find both the upper and the lower "limit". Since we are turning anti-clockwise and we have already defined the starting position, it is possible to find the lower "limit". Before we move on, bear in mind that the function has a starting and an ending point (it is not infinite) and that it is tangent to the "axes". Now, I want you to imagine a vertical line in the plane of the function. This line will act as a pointer because it will make it easier to spot when 2 points have the same abscissae.
Great, now we are ready. We start turning it a little, bit nothing interesting happens. It's still a function. When, suddenly, "y-axis" becomes vertical! This means that the vertical line is identical to axis y, so it is a tangent to the curve. Is the function still valid? Of course, since it touches it only once (by definition). However, if you turn it slightly more, it will intersect with the curve twice. So, any value above that turning make the function non-valid. But really, how much can we turn it until it becomes a function again? To answer this question, we will just continue turning, until anything interesting happens again.
And... something happens! When it's time for "axis x" to become vertical. Again, that vertical line is identical to "axis x", so it is again tangent to the curve. This is the first value that the function is valid again. From now on, all the turning positions of the function are valid, aren't they?
Well, not exactly. See, there are two ways for an "axis" to become vertical: being between the 1st & 2nd quadrants (on the top) or being between the 3rd & 4th quadrants (on the bottom). This means that there are actually two ranges for turning and making the function non-valid. The difference between them is exactly 180˚, because their "edges" are exactly 180˚ apart.
Now we know the upper and lowest points of the edges in theory, but what about in practice? How do we exactly find the degrees of turning in that range? That's pretty easy. Since we have defined "axis y" be horizontal when we start turning, it will become vertical after turning exactly 90˚. This means that the lowest "limit" of every single function is 90˚ and 270˚.
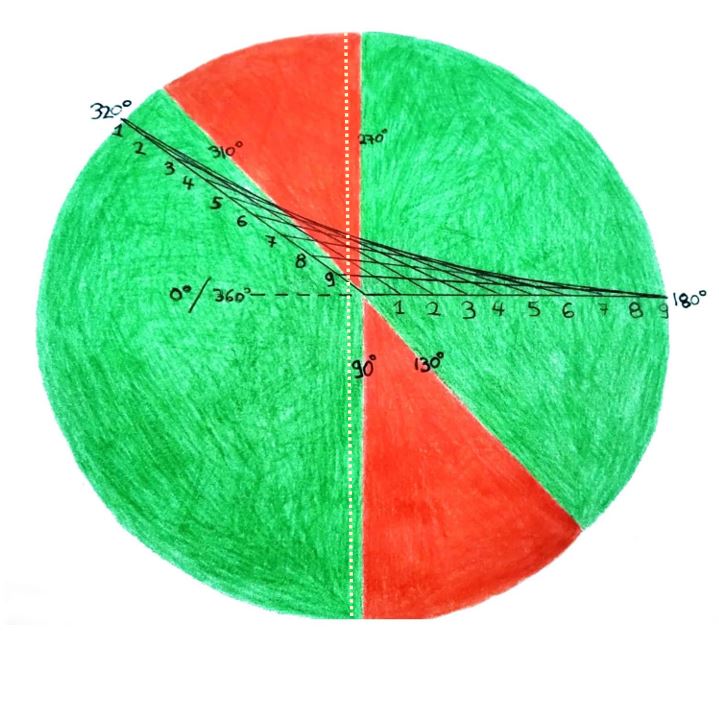
What about the upper "limit"? This is not universal and it depends on the angle of the "axes". Why? We have said that the lowest "limit" is when "axis y" becomes vertical and the upper one when "axis x" becomes vertical. However, isn't this the range of the curve? Do you remember when I asked you to find the angle between the two axes? That's where it's useful. To find upper "limit" of the non-definable range, you just add the acute angle to 90˚ and 270˚. I know that theory is hard, so here is an example:Let's say that I have counted the acute angle and it's 40˚. We just add 40˚+90˚=130˚ and 40˚+270˚=310˚. So, the function can't be defined if it is turned between 90˚-130˚ or 270˚-310˚ (with the 4 numbers being excluded) anticlockwise. Here is an image, for you to visualize the range.
- Two right angles: The process is the same with the previous case. That's why I want to challenge you to do it yourself. Try it, it worths it.
Here, the red areas is when the function of the example can't be defined. If at least one of the "axes" falls in this area, we no longer have a function. If both "axes" are in the green area, we can still call it a function. You can also spot the vertical line that helps us judge whenever a function is definable, it is the light dotted one.
I hope you haven't cheated. Anyway, here is the answer. There is an observation: if we follow the method above, we realize that there is no acute or obtuse angle here, so we will just take the value of the right one: 90˚. The minimum "limits" for the non-valid range are 90˚ and 270˚, as always. But what about the maximum ones? We need to add 90˚ on the lowest "limits". So, 90˚+90˚=180˚ and 270˚+90˚=360˚. Conclusion: the function can't be defined if it is turned between 90˚-180˚ or 270˚-360˚ (with the 4 numbers being excluded) anticlockwise.
What happens if the angle is exactly 180˚? Well, in this case, the only way to turn it and not be a function is to turn it vertically. This means that we don't have to define the domain, because if two points have the same abscissae, then all of them do. This time there is no range for not being valid, just two numbers: 90˚ & 270˚.
- An acute and an obtuse angle: We need to use a protractor to find how big the acute angle (the one marked with "n") between the "axes" is. This is essential for calculating the "limit" of the non-valid turning. We need to find both the upper and the lower "limit". Since we are turning anti-clockwise and we have already defined the starting position, it is possible to find the lower "limit". Before we move on, bear in mind that the function has a starting and an ending point (it is not infinite) and that it is tangent to the "axes". Now, I want you to imagine a vertical line in the plane of the function. This line will act as a pointer because it will make it easier to spot when 2 points have the same abscissae.
- There is another instruction I gave you at the beginning which was only for convenience’s sake: "the distances between two random neighboring points need to be the same on the two axes". Well, actually not. The distances of axis x' points don't need to be equal with the ones of axis y’s. If the distances are greater in axis y, the parabola gets wider and when the ones of axis x are greater, the opposite happens. To be even more accurate, the points of one axis don't need to be equally distant from one another. Yet, you need to keep the proportion between the distances of the two axes. For example, if axis x’s points : axis y's points = 2:1, then if the distance between points 1 and 2 on axis x is 1, then it will be 2 on axis y. If the distance between points 2 and 3 on axis x is 2, then it will be 3 on axis y etc.


-
If you draw the parabola using all the tips I mentioned, it is possible to find its formula. You don't need to draw the whole parabola, but it's vital that the two axes are marked properly. We need to have 2 points that don't belong to with the same ordinates (one of which will belong to the y axis as well) and one extra. In order for the process to be easy, I advise you to make the x axis tangent or intersecting to the parabola and choose a relatively small number for the ordinate of the point that the parabola intersects with the y axis (e.g. don't choose point (0.837), it will be too difficult); the best would be that this number is up to 15.
If you have followed my advice, you will know the abscissa and the ordinate of at least 2 points; one will be on axis x and the other in axis y. You may want to use the 2nd point of axis x as the symmetrical one, but it is easier if the point is symmetrical with the one on axis y. So, how do we find it? Also, how can that be useful for finding the equation? Let's find out!
- We need to find the abscissa of the vertex of the parabola. If the parabola is tangent to the x axis, the vertex is the touching point, so it's easy to find its abscissa. If it intersects the x axis, then it touches it in 2 points. Since the parabola is always symmetrical, its abscissa will be the average of the abscissae of the 2 points. For example, if it touches the x axis at points (-3.0) and (5.0), then (-3+5)/2=2/2=1, so the abscissa will be equal to 1.
- Now, it’s math time. We need to find the absolute value of the difference between the abscissae of the two points that have the same ordinates.
- With that done, we add the double of that number to the abscissa of the point which is not the vertex if your parabola has a minimum point. If you have turned your parabola upside down and it now has a maximum value, you subtract that number (the reason this works is because the parabola is drawn left to right if it had a min value and vice-versa, if it had a max value; if you have done it the opposite way, just make sure that you change the position of the words "add" and "subtract" in the sentence).
- This is the abscissa of the symmetrical point, which has the same ordinate as the non-cortex point.
I know that I said too much in theory, so I need to write an example for you to understand better. I am going to use this parabola, which we made earlier. So, we follow the steps.

- We can consider that it touches the axis y at point A(0.11) if you consider that the axis is fixed and that the cortex is point B(11.0)
- The abscissa of point A is 0 and of point B is 11. Now, |0-11|=11
- 2*11=22. As we have said, the abscissa of point A is 0. 0+22=22
- The point we are looking for, let's call it C, is C(22.11)
Great, we now have our 3 points. What follows now?
- The equation of the parabola is y=ax^2+bx+c. We can find the value of c. We know the point which has x=0; it's the intersection of the parabola with axis y. In the previous example, it's point A. If we replace it in the equation, we get a*0+b*0+c=11, so c=11.
- Next, we can observe that we know two points with the same ordinates. So, for them the first parts of the equations will be equal to each other. We need to replace the points in the equations. In the example, we know that points A and C have the same y. So, this means that a*0+b*0+11=a*22^2+b*22+11. Simplified as 22(22a+b)=0 and lastly 22a=-b.
- The last step is to take the equation of one point and replace in it our new findings. Here is where we need point B. Since the other 2 helped us find the relationship between a and b, replacing it there would be pointless. So, we have a*11^2+b*11+11=0
- it's simplified as 11(11a+b+1)=0
- then preparing for the replacement, -11a-b-1=0
- replacing -11a+22a-1=0
- then 11a=1 so a=1/11
- now, we can find b, because 22a=-b
- 22*1/11=-b, so b=-2.
- Now, we know that a=1/11, b=-2 and c=11. So, the equation is x^2/11-2x+11=y. We can test it to confirm that this is valid.
Outro
That's the end of this website. I really hope that you liked it. Its topic is not well-known, but it reminded something to all of us: we can't write functions without FUN! #FUNctions🙂